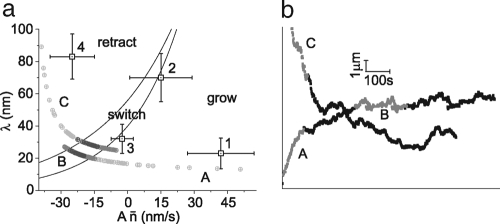
Fig. 3.
Membrane tube phase diagram and simulations. (a) Phase diagram showing mean retraction distance λ vs. effective growth speed An̄. Lines represent the switching condition described by Eq. 2 for Aσn = 50 nm/s and Aσn = 70 nm/s. Squares 1-4 correspond to traces 1-4 in Fig. 1b, where the errors are determined by the mean square difference between the data points and the fit of the distribution in Eq. 1. As expected qualitatively, retracting membrane tubes fall well into the retraction regime with large retraction distance and small cluster sizes, while growing membrane tubes have large cluster sizes and smaller distances between clusters. (b) Two simulated tube tip traces of a membrane tube pulled by nonprocessive motors. The time evolution of the parameters λ and An̄ for both traces is shown in the phase diagram (a), by circles getting darker in time. We see that both simulated tubes evolve towards a switching state. The highlighted sections of the simulated traces represent all possible characteristic behaviors of tubes pulled by nonprocessive motors.

