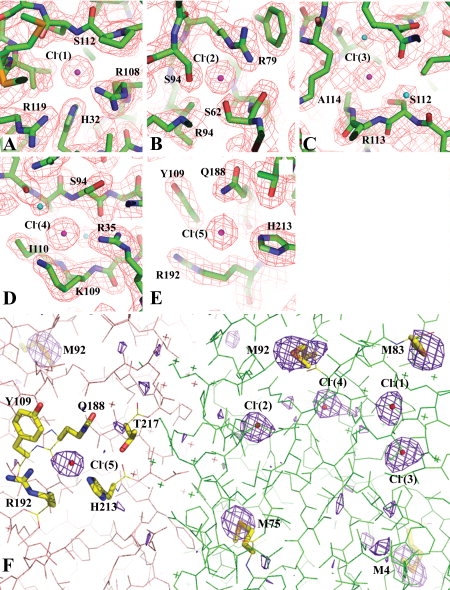
Figure 3.

The Cl− binding sites and Cl− anomalous diffration. The Cl− binding sites and anomalous difference maps obtained using data collected at 7 keV. (A–E) The five Cl− ions and their interactions with neighboring protein residues. The omitted 2Fo–Fc Fourier difference maps in all these figures were contoured at a 1.3 σ level. These maps were calculated using a 1.9 Å data set (Table I). (F) The anomalous difference map contoured at 3 σ level calculated at 2.5 Å using data collected at 7 keV. The map shows the anomalous scatterers including five chloride ions (in the format of small red balls) and several selenium atoms from SeMet residues (in the stick format). The sulfur atom of Cys33 also shows a similar anomalous peak (out of the view in this figure). Two Vp-ZntB monomers in the background are drawn in two different colors. The “X” represents water molecules.
