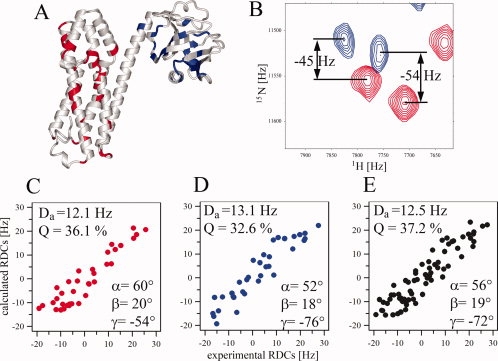
Figure 2.

Domain orientation in DH-PH studied by RDCs. (A) DH-PH from the crystal structure of the complex showing the locations of 1DHN RDCs measured for residues in DH (red) and PH (blue); (B) an example of 1H-15N TROSY-HSQC (red); and 1H-15N HSQC (blue) for 2H,13C,15N-DH-PH aligned in positively charged polyacrylamide gel used to extract 1DHN RDCs. (C–E) Fitting of experimental RDCs for DH, PH, and DH-PH, respectively, to the crystal structure. Magnitude of the alignment tensor (Da), Q-factors and Euler angles are shown for each analysis.
