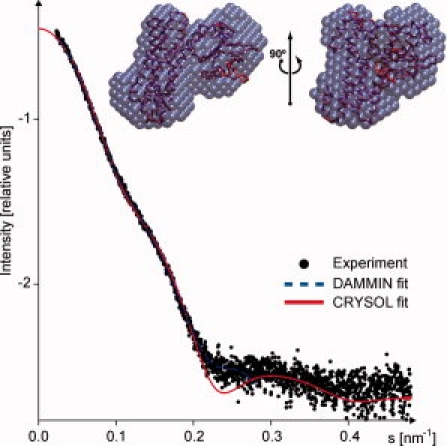
Figure 3.

SAXS profiles of DH-PH (see text for details). Dots denote the experimental data, the fits obtained by DAMMIN32 and CRYSOL are shown as blue dashed and red solid lines, respectively. Inset: The averaged ab initio shape obtained from SAXS data is presented by blue beads, the crystallographic model is shown as red Cα-trace.
