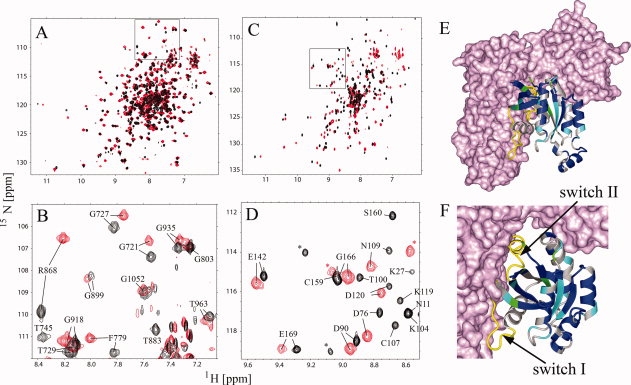
Figure 4.

Solution NMR of the DH-PH/RhoA complex. (A) Comparison of the 1H-15N TROSY-HSQC spectra of DH-PH (black) and DH-PH/RhoA (red); (C) comparison of the 1H-15N TROSY-HSQC spectra of RhoA (black) and RhoA-DHPH (red); (B,D) assigned fragments of the squared regions in (A) and (C), respectively; unassigned residues are labeled with asterisk; (E,F) mapping of the assigned resonances onto the model of RhoA (ribbon) in the complex with DH-PH (surface representation); residues exhibiting small chemical shift perturbations (Δσ < 0.06 ppm) are blue, medium (0.06 ppm < Δσ < 0.15 ppm) are cyan and strongest (Δσ > 0.15 ppm) are green; residues that were not assigned are gray; chemical shift perturbations were calculated using the following formula sqrt(ΔσHN2+ 0.1 ΔσN2). Switch I and II regions of RhoA which were not assigned are shown in yellow and labeled.
