Figure 5.

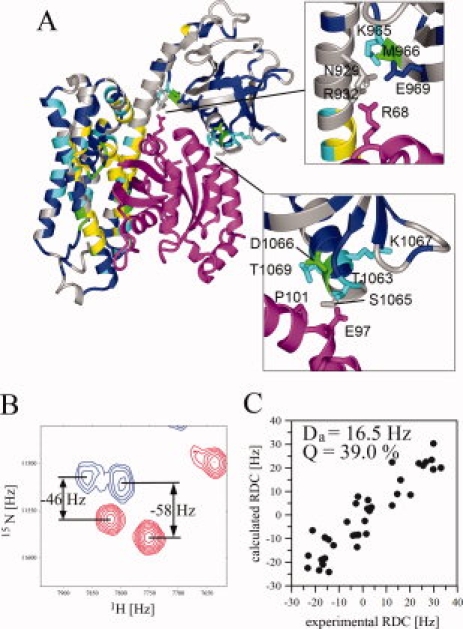
Characterization of the structure of DH-PH/RhoA complex in solution; (A) mapping of chemical shift perturbations within DH-PH upon binding to RhoA (magenta); two regions showing contacts involving RhoA and PH domain are shown in insets; residues exhibiting small chemical shift perturbations (Δσ < 0.05) are blue, medium (0.05 < Δσ < 0.10) are cyan and strongest (Δσ > 0.10) are green; residues that could be assigned only for free DH-PH and experience very strong perturbations in the complex are yellow; residues without assignment for free DH-PH are gray; chemical shift perturbations were calculated using the following formula sqrt(ΔσHN2+0.1ΔσN2). (B) An example of 1H-15N TROSY-HSQC (red) and 1H-15N HSQC (blue) for 2H,13C,15N-DH-PH/RhoA aligned in positively charged polyacrylamide gel, used to extract 1DHN RDCs; (C) fitting of RDCs measured for the DH-PH in the complex with RhoA to the crystal structure.
