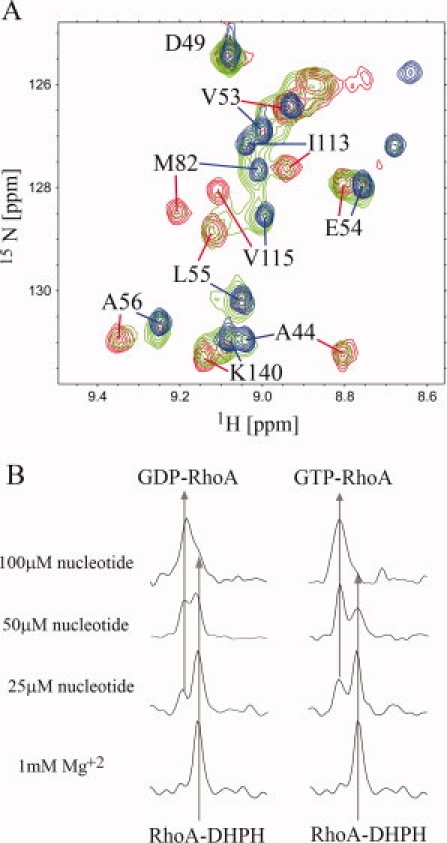
Figure 7.

Nucleotide induced dissociation of the DH-PH/RhoA complex. (A) fragment of the superimposed 1H-15N TROSY-HSQC spectra showing the comparison of the of 80 μM nucleotide free DH-PH/2H,15N-RhoA (red), the 80 μM DH-PH/2H,15N-RhoA complex in the presence of 50 μM GDP (green) and 100 μM 2H,15N RhoA•GDP (blue). (B) extraction of 1D traces from 1H-15N TROSY-HSQC spectra used to follow the dissociation of the complex by guanine nucleotides; the arrows show chemical shifts of the C-terminal Ala181 amide proton of RhoA bound to DH-PH (upfield signal) and nucleotide (downfield signal); left and right panels shows the titration of DH-PH/RhoA complex with GDP and GTP, respectively.
