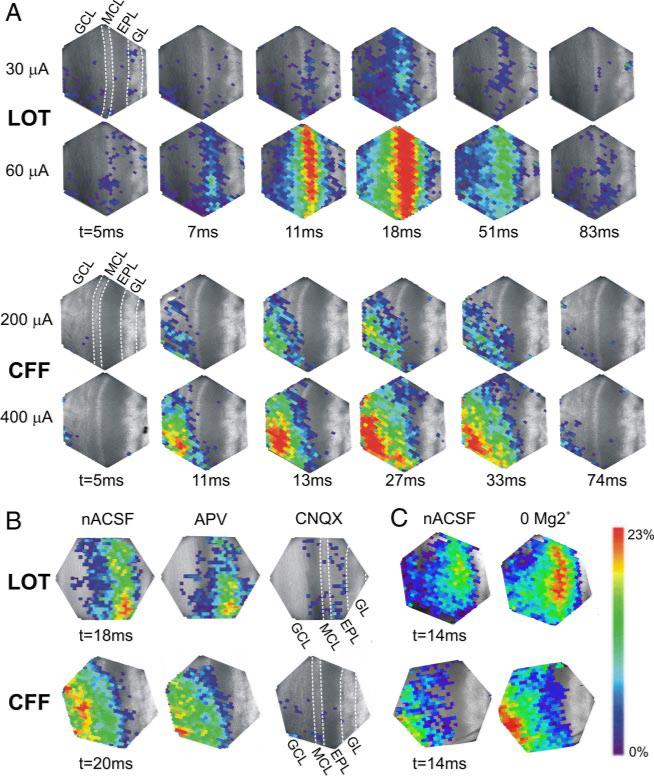
FIG. 3.
Spatiotemporal pattern of optical signals after activation of the LOT (top 2 rows) or CFF tract (bottom 2 rows). Poststimulus time intervals (t, in ms) are shown below each image. A, top: responses elicited by peri-threshold stimulation intensity (LOT, 30 μA; CFF, 200 μA); bottom: responses elicited by 2×-threshold level stimulation intensity (LOT, 60 μA; CFF, 400 μA). B: effects of ionotropic glutamate receptor antagonists. Left: maximal amplitude and spatial extent of LOT (top)- and CFF-evoked (bottom) responses in nACSF; stimulation intensity: LOT, 60 μA; CFF, 200 μA. The N-methyl-d-aspartate (NMDA) receptor antagonist APV moderately reduced the amplitude and spatial extent of the evoked responses (middle), whereas subsequent application of the AMPA receptor antagonist 6-cyano-7-nitroquinoxalene-2,3-dione (CNQX) nearly completely abolished the responses (right). Poststimulus intervals for APV and CNQX are the same as in nACSF. C: enhancement of NMDA receptor activity increases LOT (top)- and CFF-evoked (bottom) responses; stimulation intensity: LOT, 40 μA; CFF, 200 μA. Left and right, respectively: responses in nACSF and responses after slices were perfused with Mg2+-free ACSF (0 Mg 2+). The poststimulus intervals shown (14 ms) correspond to the time of maximal responses in nACSF. Results shown in A–C are from different slices.

