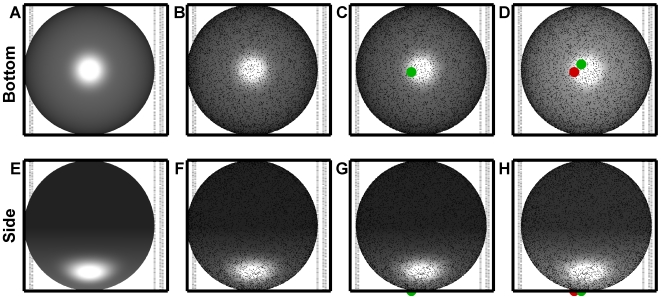
Figure 2. Iterative calculations in the simulation.
(A,E) An initial gap size, generally small compared to the sphere's radius, was randomly selected from the governing equilibrium distribution. (B,F) Receptors were randomly distributed over the surface. Fluid flow was started. Forces and torques were calculated, a diffusive component was added, the new sphere position and rotation was calculated, and receptors were tested for bond formation. (C,G) The sphere was translated and rotated into the new position. One bond formed in the calculation from the previous step. New force calculations on the bonds and sphere were performed. The bond's green color indicates the sphere had not yet moved enough to begin mechanically stressing the bond. The new sphere position and rotation was calculated based on the forces and toques plus the diffusive component, then free receptors were tested for formation, and the existing bond was tested for breakage with the current position. (D,H) The sphere was translated and rotated into the new position. The brighter sphere coloring indicates the sphere moved closer to the ligand-coated surface. Vertical motion was significant compared to the length of a bond. The bond from the previous step was still present, and a new bond formed. If the new bond were to survive until it became stressed, it would exert a force perpendicular to the flow direction that will cause the sphere to wobble because it is off the sphere's center line. Force calculations on the bonds and sphere were performed. The red color indicates the trailing bond was stressed and exerted forces and torques on the sphere. Next, the diffusive component would be added to the forces and torques on the sphere, the new sphere position and rotation would be calculated, then free receptors would be tested for formation and the existing bonds would be tested for breakage. The position would be updated and the calculation iterated.

