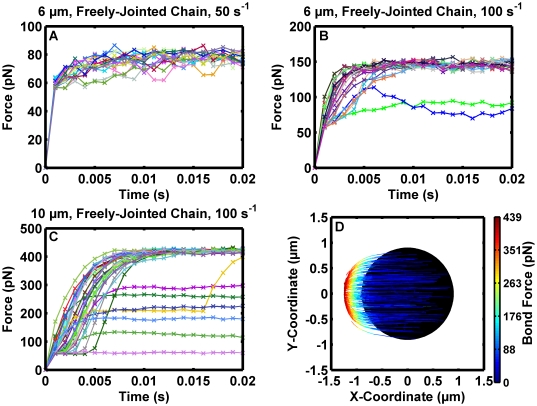
Figure 5. Loading patterns demonstrate how bond forces influence sphere motion.
Reactive spheres were simulated with nL° = 100 sites/µm2, nR° = 50 sites/µm2, association kinetics governed by (1), and dissociation kinetics governed by (3). Note that the step function in the freely-jointed chain model, (6), resulted in a step from zero force to 56 pN as the tether extended past 92 nm, and then force continued to increase continuously. (A) A sample of bond loading data for 6 µm-diameter spheres with a 50 s−1 wall shear rate. (B) Results from a simulation for 6 µm-diameter spheres with a 100 s−1 wall shear rate. Note that bonds were aligned to their respective initial loading points in the figure, so the total instantaneous force exerted by the concurrent bonds, shown by the green and blue tracings, on the sphere cannot be calculated by summing the two values at the same time point on the plot. (C) Bond loading results from a 10 µm-diameter sphere at a 100 s−1 wall shear rate. Of the three cases, the larger sphere had the most bond loading events and also was the most likely to form simultaneous hydrodynamic force bearing bonds. (D) Loading trajectories for single, force-bearing bonds. Data were compiled from simulation runs for 10 µm-diameter spheres with a 100 s−1 wall shear rate. Individual tracings represent individual bond events, with position coordinates representing the position of the bond tether point on the sphere relative to the center, projected onto the XY plane. The color depicts the force on the bond. The black circle illustrates the expected contact patch for unstressed bonds when the sphere touches the wall to within the limits of the assumed roughness. Single bonds only supported minimal force initially, evident in the first 5 ms of loading in (C), but could only cause the sphere to wobble once the tether point exited the contact patch, apparent in (D).

