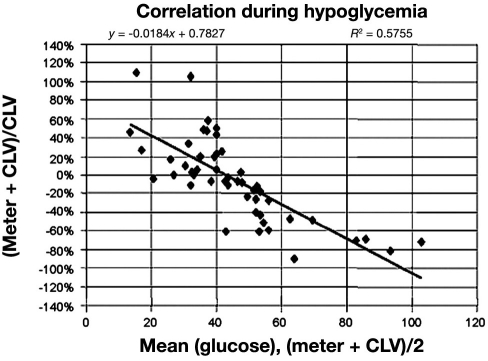
Figure 6.
Difference plot of the Accu-Chek Comfort (Roche) and a CLD (the Bland—Altman plot) at hypoglycemic values. Meter, glucose meter readings; CLV, central laboratory value. Reprinted with permission from Archives of Pathology and Laboratory Medicine.67

