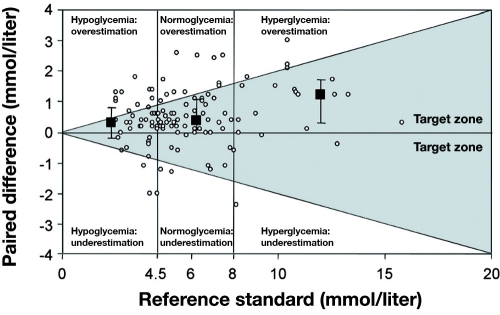
Figure 7.
Paired differences (n = 118) between glucose meter analysis of capillary blood and reference standard for all 30 patients. Paired differences were calculated by subtracting reference standard values from capillary sample values. Medians and interquartile ranges are presented for each blood glucose stratum. Data represent 118 paired observations for 30 patients. Data points reflecting a paired difference >0 indicate an underestimation. Reprinted with permission from Critical Care Medicine.32

