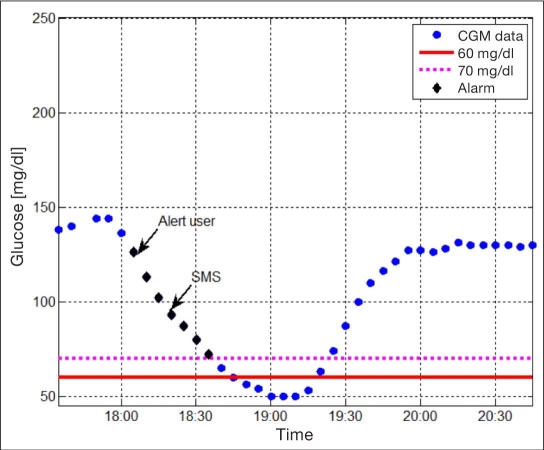
Figure 4.
Illustration of the performance of a simple alert algorithm on historical CGM tracing denoted as blue circles, where the algorithm alerts are marked as black diamonds. As can be seen, a warning is issued to the user when glucose is ∼120 mg/dl, and an SMS is sent when crossing the 90 mg/dl threshold. The red and magenta dotted lines denote the 60 mg/dl (clinical) and 70 mg/dl (algorithm) hypoglycemia threshold, respectively.

