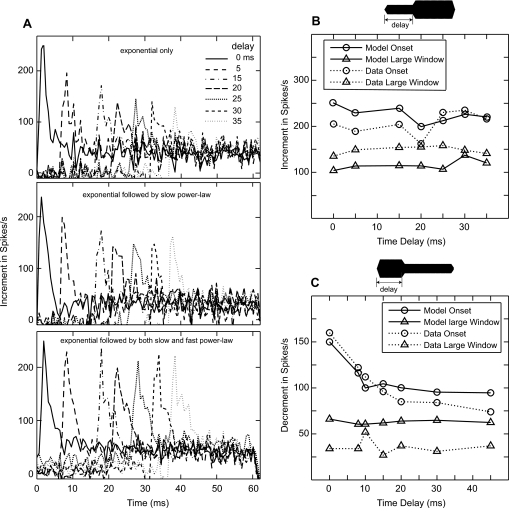
Figure 9.
Effects of prior adaptation on increment and decrement responses. (A) Model increment responses as a function of time for three different conditions of the synapse model (with only exponential adaptation, exponential followed by slow power-law adaptation, and exponential followed by both slow and fast power-law adaptations). (B) Increment responses from both actual and PLA model responses. (C) Decrement responses. The stimulus was a 60-ms CF tone 13 dB above threshold, and subsequently levels were either increased or decreased by 6 dB at different delays from onset. The resulting increment∕decrement responses are obtained by subtracting the response to the constant-intensity tone (pedestal) from the response to the tone with an increment∕decrement in level. Changes in rate responses for both the onset window (first 0.64 ms, circles) and a larger window (first 10.2 ms, downward triangles) are shown. Dotted lines with symbols show the actual data (data points from Figs. 5 and 7 of Smith et al., 1985), and the solid lines with symbols represent the corresponding PLA model responses. (B) Increment responses. CF at 4.16 kHz (HSR). (C) Decrement responses. CF at 3.58 kHz (HSR).

