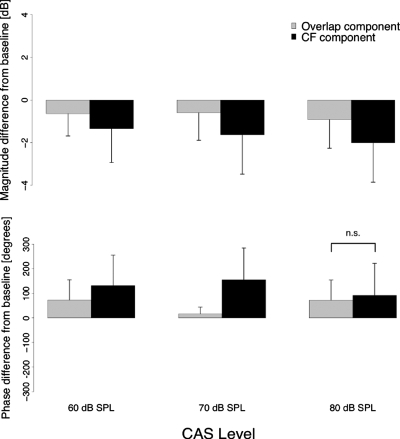
Figure 7.
Average change in level (top) and phase (bottom) in DPOAE components due to different levels of contralateral noise. The reported differences were calculated by first averaging the component level or (unwrapped) phase over the entire recorded frequency range and then subtracting the average values of the NoN condition from the average values for each noise condition. Error bars represent one standard deviation. Top panel: change in each component level for three different noise levels. Bottom panel: change in each component phase for three different noise levels. All contrasts between the two components were statistically significant (p<0.05) except the change in phase of the two components for the contralateral noise level of 80 dB SPL.

