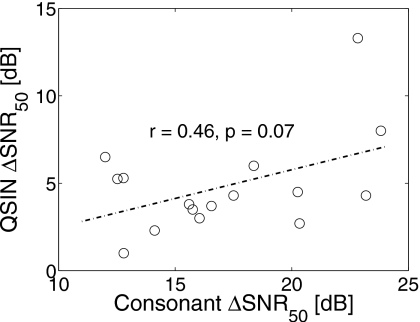
Figure 2.
A comparison of ΔSNR50 values estimated from our consonant recognition data (abscissa) and those measured using QuickSIN (ordinate). A linear regression line (dashed-dotted) is shown along with the correlation coefficient (r) and null-hypothesis probability (p) for the two sets of ΔSNR50 values.

