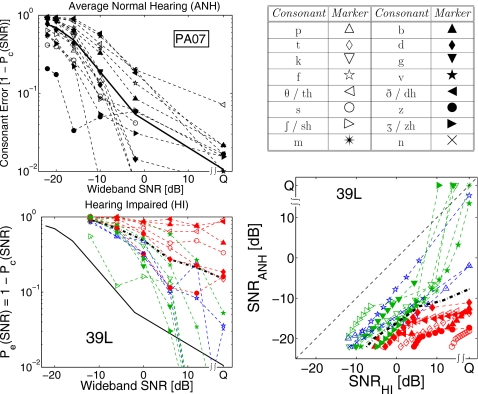
Figure 4.
Top left: Consonant recognition errors Pe(SNR) on a log scale for average normal hearing data from Phatak and Allen (2007). The solid line shows the average consonant error. Top right: Marker symbols for the consonants. Bottom left: Pe(SNR) for HI listener 39, left ear. Thick, dash-dotted line shows the average consonant error for 39L, while solid line shows average consonant error for the ANH data (from top left panel). Bottom right: The consonant loss profile for HI ear 39L. The dashed reference line with no symbols represents ΔSNR=SNRHI−SNRANH=0 and the thick dash-dotted line is the average consonant loss curve.

