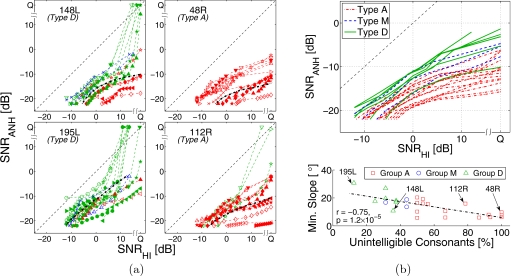
Figure 6.
(a) Examples of type A (148L, 195L) and type D (48R, 112R) consonant loss profiles. The average consonant loss curves (thick, dash-dotted) are shown in black. (b) Top: The average consonant loss curves for all HI listeners. The CLP types associated with the curves are represented by line styles. Bottom: Comparison of percentage of unintelligible sounds in each CLP vs the minimum slope (in degrees) of the corresponding average consonant loss curve. Regression line and correlation coefficient are shown.

