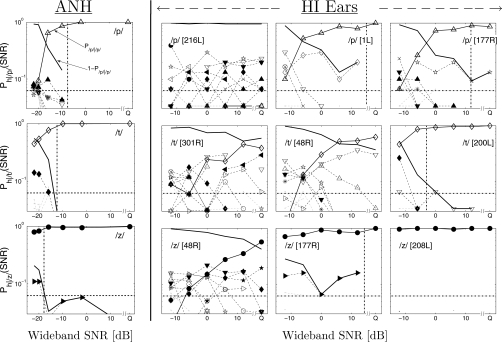
Figure 9.
Three examples of consonant CPs for the ANH data are shown in the left column. The three examples are for consonants ∕p∕ (Δ, top row), ∕t∕ (◇, center row), and ∕z∕ (●, bottom row). The consonant CPs from three different HI ears (right three columns) are shown for each of these three consonants. Each dashed curve represents confusion with a consonant, denoted by the symbol. The legend of consonant symbols is provided in Fig. 4. The vertical dashed line in each panel indicates SNR90, i.e., the SNR at Pc=90%.

