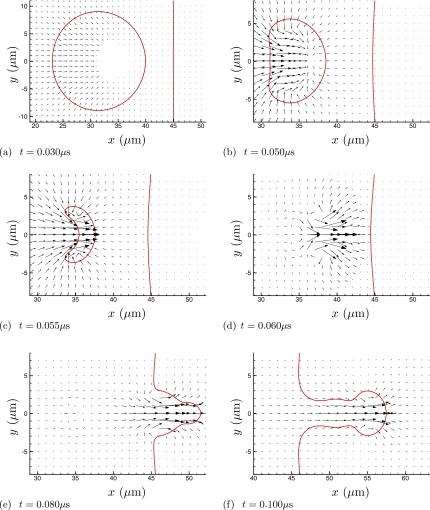
Figure 2.
Velocity vectors at times during the collapse and jetting for the μ=0.1 Pa s case with w=D∕4=5 μm. Note that the scale is different in (a) to show the full bubble at the beginning of its collapse. The lines show the ρ=0.5ρliquid and ϕf=0.5 isopleths. The vector associated with only every eighth mesh point in each coordinate direction is plotted. For reference, in (a), the shock front is just leaving the region shown.

