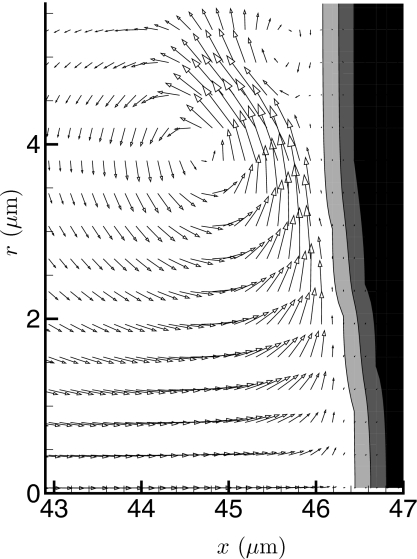
Figure 7.
Velocity vectors showing the high strain rate parallel to the viscous region for the highest viscosity case (μ=10 Pa s) at simulation time t=0.83 μs. Only every third vector is shown in the y direction. The gray levels show the finite thickness phase-field model of the interface between the two fluids. The contour levels are ϕ=0.01,0.5,0.99.

