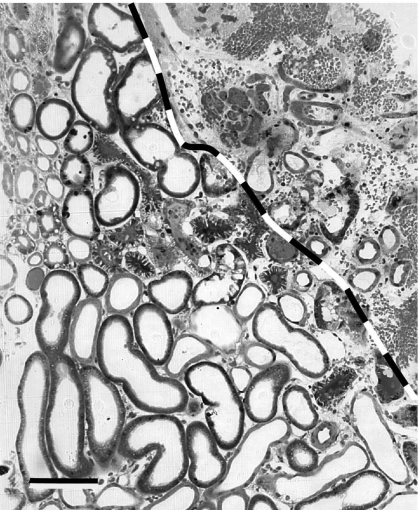
Figure 8.
Image of renal injury similar to that of Shao et al. (Ref. 46) with line added demarking the apparently sharp boundary between regions of utterly disrupted (top, right) and intact tubules. The intact tubules immediately adjacent the line drawn show signs of ischemic injury, but within 3 or so tubules distances, they appear completely normal (bottom, left). The scale bar is approximately 50 μm wide.

