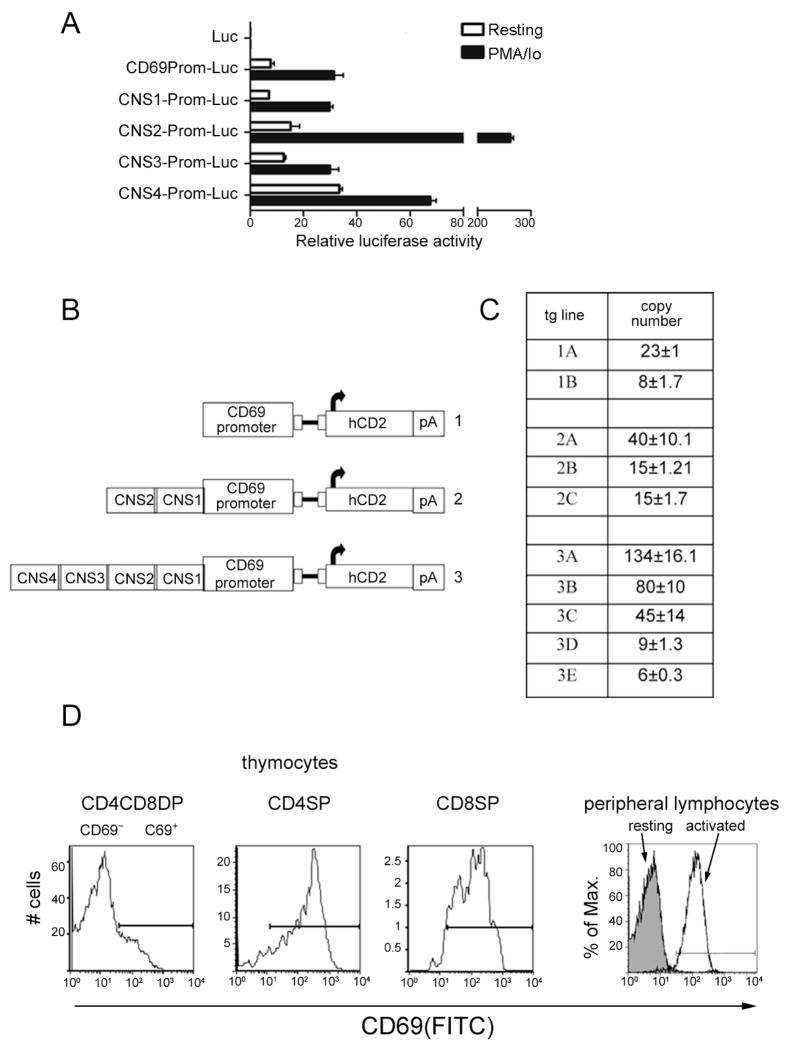
Figure 4. Characterization of CNS function in transfected cells and transgenic mice.
(A) Luciferase activity of reporter constructs in unstimulated or stimulated Jurkat cells. Results are expressed as the mean ±SEM of duplicate transfections and are representative of three experiments. (B) Representation of hCD2 reporter constructs used to generate transgenic mice. (C) Copy numbers of transgenic lines were determined by real time PCR. Values for construct 1 represent the average amplification using hCD2 primers. Values for construct 2 represent the average amplification using CNS1 and hCD2 primers, and values for construct 3 represent the average amplification using CNS4, CNS3, CNS1 and hCD2 primers. (D) Flow cytometric analysis of CD69 expression in thymus and resting and activated peripheral lymphocytes, indicating gating for CD69+ and CD69− populations.

