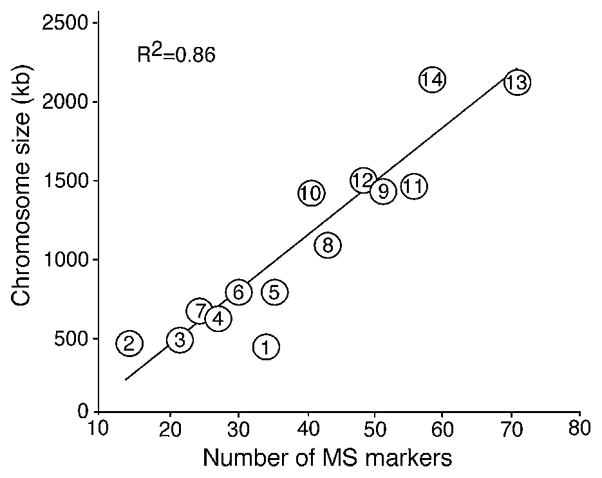
Fig. 2.

Relationship of the number of microsatellite (MS) on each chromosome and the chromosome length. Total numbers of nucleotide numbers (base pairs) from all the contigs assigned to a chromosome were plotted against the numbers of MS markers identified. The numbers inside each circle indicate each of the 14 chromosomes. R2 is the correlation coefficiency for the regression line.
