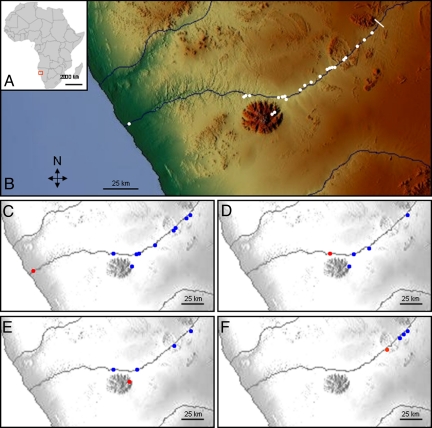
Fig. 1.
Distribution of trees within the study site and pollen movements between them. (A) Position of the field site in Namibia, Southern Africa. (B) Distribution of adult trees mapped along the Ugab River. Individuals or clusters of trees are represented by white dots (for map coordinates see Table S1). Paternity assignments relating to individual female parents (red) and assigned pollen donors (blue) as follows: (C) Tree-1 mother, (D) Tree-3 mother, (E) Tree-17 mother, (F) Tree-41 mother. The base map was obtained from www.maps-for-free.com.

