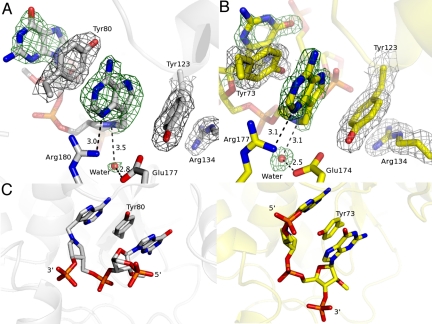
Fig. 3.
Catalytic site geometries for cyclic inhibitor G(9-DA)GA 2′-OMe bound to RTA and SAP. (A) π-Stacking interaction between the inhibitor and RTA is shown. The 2mFo-DFc electron density map and the inhibitor- and water nucleophile-omit mFo-DFc map were drawn in gray at a contour level of 1σ and in green at a contour level of 3σ, respectively. Glu-177 and Arg-180 are shown. (B) π-Stacking interaction between the inhibitor and SAP is shown. The 2mFo-DFc electron density map and the inhibitor- and water nucleophile-omit mFo-DFc map were drawn in gray at a contour level of 1σ and in green at a contour level of 3σ, respectively. Glu-174 and Arg-177 are indicated. (C) Comparison of inhibitor-bound RTA (Left, gray) and inhibitor-bound SAP (Right, yellow). The tyrosine involved in π-stacking is indicated. Distances in A and B are in angstroms.

