Fig. 3.
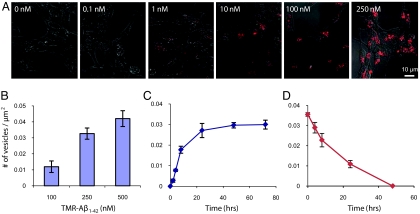
Dose- and time-dependence of vesicular uptake of TMR-Aβ1–42. SHSY5Y cells were grown in varying concentrations of TMR-labeled Aβ1–42 (1–250 nM as indicated (A), then imaged using confocal microscopy after 24 h. Fluorescent vesicles were quantified, and demonstrated dose-dependent uptake (B). SHSY5Y cells were grown in 250 nM TMR-Aβ1–42,imaged at varying times (0–72 h) thereafter (Fig. S1A), and fluorescent vesicles were quantified (C). SHSY5Y cells were grown in 250 nM TMR-Aβ1–42 for 24 h, TMR-Aβ1–42 was washed out of the medium, imaged a various times thereafter (Fig. S1C), and fluorescent vesicles were quantified (D). After washout, the number of fluorescent vesicles decreased with time, disappearing by 48 h. Error bars, s.e.m. from three independent experiments.

