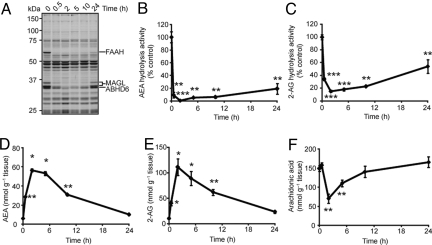
Fig. 3.
Time course analysis of inhibitory activity of JZL195 in vivo. (A–C) Serine hydrolase activity profiles (A) and AEA (B) and 2-AG (C) hydrolytic activities of brain membranes prepared from mice treated with JZL195 (20 mg·kg−1, i.p.) for the indicated times. (D–F) Brain levels of AEA (D), 2-AG (E), and arachidonic acid (F) from mice treated with JZL195 (20 mg·kg−1, i.p.) for the indicated times. For B–F, *, P < 0.05; **, P < 0.01, ***, P < 0.001 for inhibitor-treated versus vehicle-treated control animals. Data are presented as means ± SEM. n = 3–5 mice per group.

