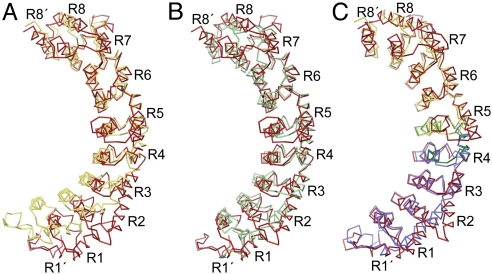
Fig. 4.
Defining FBF RNA-binding specificity. (A) Superposition of the CA traces of FBF-2 (red) and PUM1 (yellow) aligning repeats 5–8. (B) Superposition of the CA traces of FBF-2 (red) and yeast Puf4p (green) aligning repeats 5–8. (C) Superposition of the CA traces of FBF-2 (red) and N-terminal (blue) and C-terminal (yellow) halves of PUM1. The separated halves of PUM1 were individually aligned with the corresponding region of FBF-2. The 45-residue region of FBF-2 that transfers 9-nt specificity to PUF-8 is shown in green and contains the hinge point between repeats 4 and 5. DynDom analysis also suggests that there are 2 smaller angle changes between repeats 3 and 4 and repeats 5 and 6. In C, the FBF-2 structure is rotated 15° about the y axis relative to A and B.

