Figure 1.

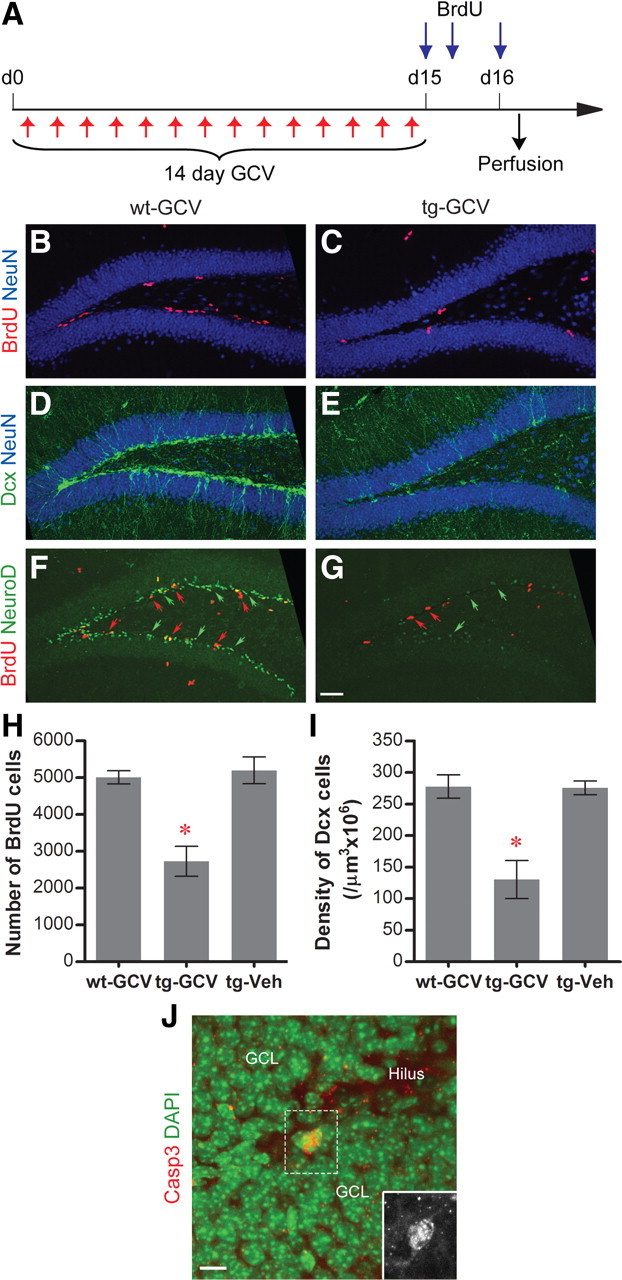
Reduction of neurogenesis in the DG of GCV-treated Nestin-tk transgenic mice. A, The experimental scheme. B–G, Representative confocal images of adult DG from wt-GCV and tg-GCV mice labeled by cell proliferation marker BrdU (red in B, C, F, G, red arrows in F, G), immature neuron markers Dcx (green in D, E) and NeuroD (green staining and green arrows in F, G), and mature neuron marker NeuN (blue, B–E) in DG. H, BrdU cell number is reduced in tg-GCV compared to wt-GCV and tg-Veh (ANOVA, F(2,21) = 17.20, p < 4 × 10⁻⁵, n = 8 for each group). I, Density of Dcx cells is reduced in tg-GCV (ANOVA, F(2,21) = 15.70, p < 7 × 10⁻⁵, n = 8 for each group). J, K, Increased apoptosis in tg-GCV mice. J, Representative image of the activated-caspase 3-positive cells; the inset is a blowup for the activated-caspase 3-positive cell without the DAPI counterstaining. K, The number of activated-caspase 3-positive cells is increased in tg-GCV mice (t(6) = 4.02, p < 0.0070; n = 4 for each group). Scale bars: G (for B–G), 50 μm; J, 10 μm. *p < 0.01. Error bars represent ± SEM.
