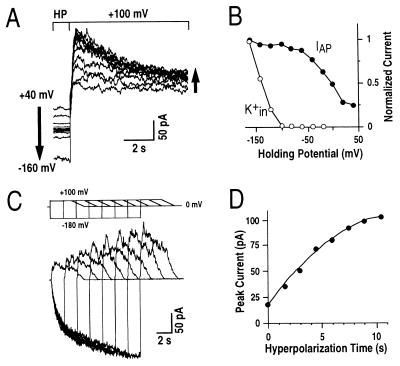
Figure 4.
IAP magnitudes are enhanced by more negative prepulse holding potentials and by longer hyperpolarization times. (A) IAP magnitudes were enhanced when prehyperpolarization potentials were more negative. Left arrow shows the changes of holding potentials, and right arrow indicates the associated increasing IAP amplitudes. Prehyperpolarizations ranged from +40 mV to −160 mV in increments of −20 mV. The interval time between pulses was 60 sec at holding potential (HP). (B) Normalized IAP peak amplitudes and K+in currents plotted against respective prepulse holding potentials for the data in A. Similar results were analyzed in three representative cells. (C) Increasing durations of prehyperpolarizations enhanced the magnitude of IAP. Data from a representative cell show increasing prehyperpolarization times at −180 mV. (Upper) Voltage protocol is shown. In the voltage protocol, voltage ramps were used after depolarization to stabilize the cells because large prolonged and repetitive depolarizing voltage pules often led to loss of whole-cell recordings. (D) IAP peak amplitudes plotted against respective prepulse hyperpolarization times from experiments performed as in C. Similar results were obtained in four cells. A pipette solution with nominally zero Ca2+ concentration and a standard bath solution were used.

