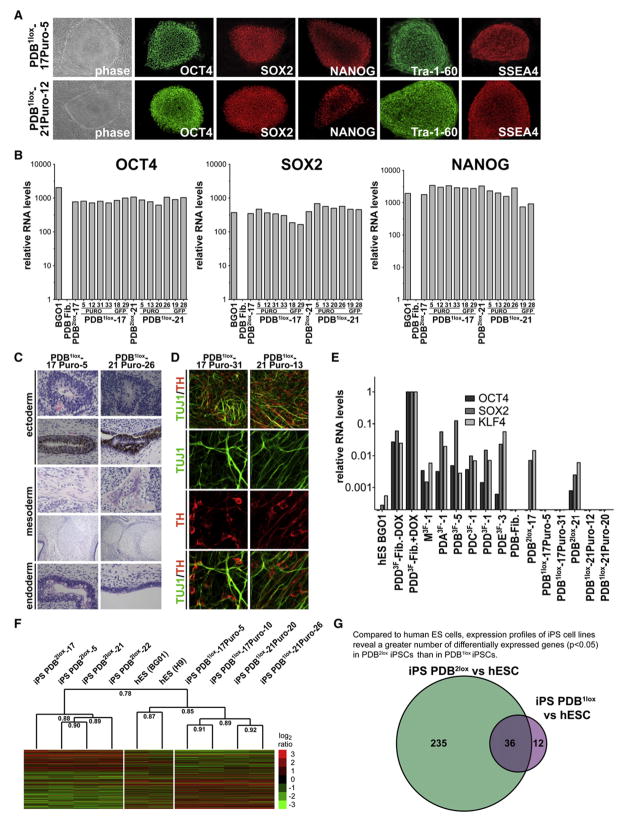
Figure 6. Characterization of Reprogramming Factor-free hiPSCs.
(A) Phase contrast picture and immunofluorescence staining of reprogramming factor-free hiPSC lines PDB1lox-17Puro-5 and PDB1lox-21Puro-12 for pluripotency markers SSEA4, Tra-1-60, OCT4, SOX2, and NANOG.
(B) Quantitative RT-PCR for the reactivation of the endogenous pluripotency-related genes NANOG, OCT4, and SOX2 in hESCs, fibroblasts (PDB), provirus-carrying PDB2lox clones (PDB2lox-17 and PDB2lox-21), and indicated PDB1lox clones after Cre-recombinase-mediated excision of the transgenes. Relative expression levels were normalized to the expression of these genes in fibroblasts.
(C) Hematoxylin and eosin staining of teratoma sections generated from factor-free PDB1lox-17puro-5 and PDB1lox-21puro-26 cells.
(D) Immunofluorescence staining of neuronal cultures derived from factor-free PDB1lox-17puro-31 and PDB1lox-21puro-13 hiPSCs for neuron-specific class III β-tubulin (TUJ1; green) and the dopaminergic neuron-specific marker tyrosine hydroxylase (TH; red). Neuronal cultures were derived with an embryoid body (EB)-based differentiation protocol.
(E) Quantitative RT-PCR for residual transgene expression of OCT4, KLF4, and SOX2 in hESCs (BG01), primary fibroblasts (PDB), primary infected fibroblasts (PDD3F ± DOX), hiPSCs (M3F3-1), PD-derived hiPSCs (PDA3F-1, PDB3F-5, PDC3F-1, PDD3F-1, PDE3F-3), provirus-carrying PDB2lox clones (PDB2lox-17 and PDB2lox-21), and the reprogramming factor-free PDB1lox clones (PDB1lox-17Puro-5, PDB1lox-17Puro-31, PDB1lox-21Puro-12, PDB1lox-21Puro-20). Relative expression levels are normalized to DOX-induced expression in primary infected fibroblasts.
(F) Comparison of gene expression profile of hESCs (BG01, H9), factor-carrying PDB2lox lines (PDB2lox-5, PDB2lox-17, PDB2lox-21, PDB2lox-22), and factor-free PDB1lox lines (PDB1lox-17Puro-5, PDB1lox-17Puro-10, PDB1lox-21Puro-20, PDB1lox-21Puro-26). All genes (n = 1434) showing at least 2-fold differential expression between factor-free hiPSCs and factor-carrying hiPSCs cells were ordered by this ratio and hierarchically clustered by sample (using uncentered correlation and average linkage). All log2 ratios are relative to expression in fibroblasts. Numbers shown in dendrogram indicate Pearson correlation between clusters. The expression profile of factor-free hiPSCs is higher correlated to hESCs than the expression profile of factor-carrying hiPSCs as tested by Fisher’s Z transformation (p < 1e-7). Confidence of the hierarchical clustering was computed with multiscale bootstrap resampling, generating in more than 99% a cluster between the hESCs and all factor-free PDB1lox lines.
(G) Venn diagram displaying the number of differentially expressed genes (p < 0.05 determined by moderated t test, corrected for false discovery rate) between provirus-carrying PDB2lox lines (PDB2lox-5, PDB2lox-17, PDB2lox-21, PDB2lox-22) compared to hESCs (H9, BG01), or reprogramming factor-free PDB1ox lines (PDB1lox-17Puro-5, PDB1lox-17Puro-10, PDB1lox-21Puro-20, PDB1lox-21Puro-26) compared to hESCs (H9, BG01), respectively.

