Figure 1.
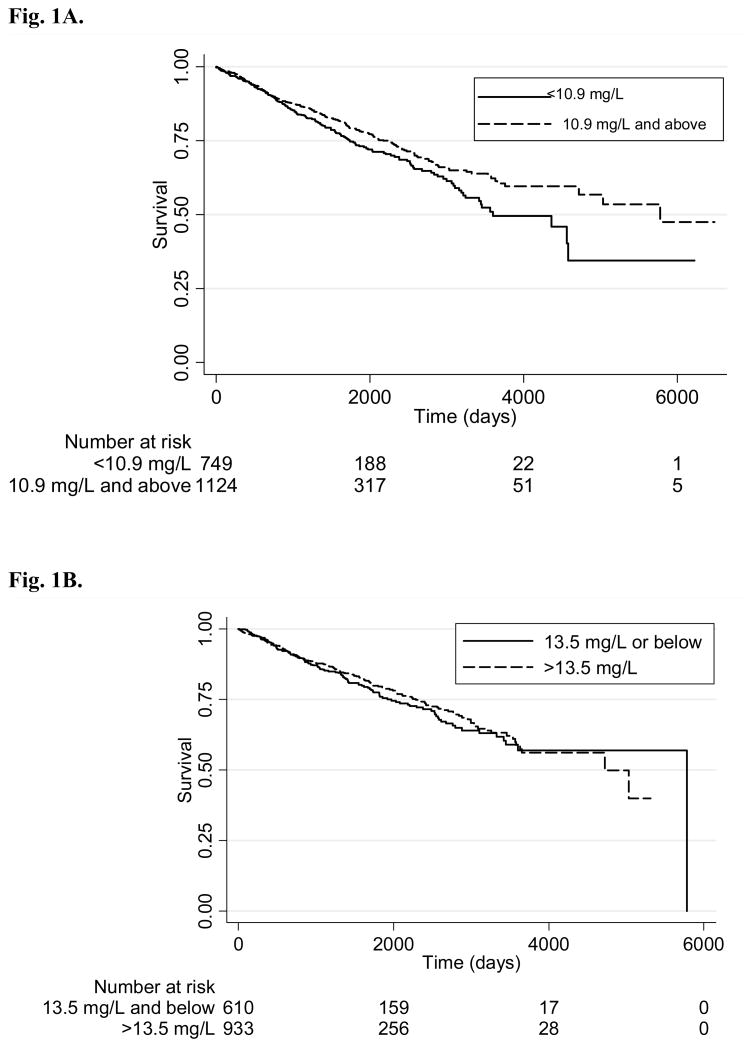
Fig. 1A. Prostate cancer survival by serum α-tocopherol at baseline. Kaplan-Meier plots of the probability of not dying from prostate cancer from the date of diagnosis for those in the 1st and 2nd quintiles of baseline serum α-tocopherol and those in the 3rd – 5th quintiles (≥ 10.9 mg/L). Below each graph is the total of men at risk for the same time points. Log-rank test for equality of survivor functions: Pr>chi2 = 0.03.
Fig. 1B. Prostate cancer survival by serum α-tocopherol at three years. Kaplan-Meier plots of the probability of not dying from prostate cancer from the date of diagnosis for those in the 1st and 2nd quintiles of serum α-tocopherol at three years after entry on trial and those in the 3rd -5th quintiles (> 13.5 mg/L). Only men with a prostate cancer diagnosis after three years from entry on trial are included. Below each graph is the total of men at risk for the same time points. Log-rank test for equality of survivor functions: Pr>chi2 = 0.52.

