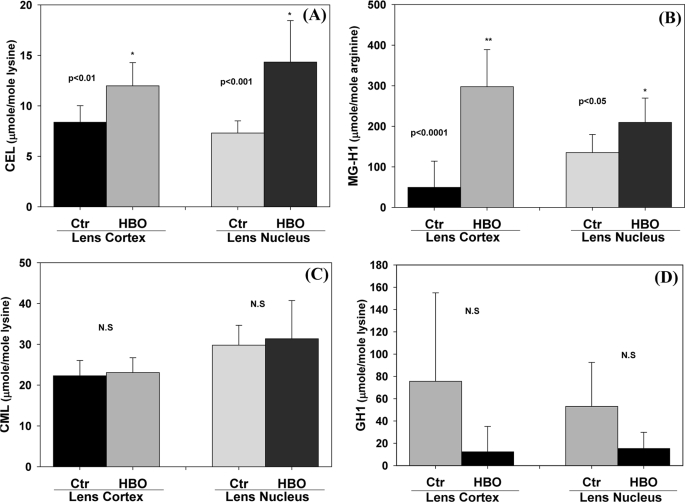
FIGURE 7.
Rabbit lens insoluble fraction AGEs level before and after hyperbaric oxygen treatment. For details see the legend for Fig. 6. A, CEL (p < 0.01 (cortex versus ctr); p < 0.001,(nucleus versus ctr)); B, MG-H1 (p < 0.0001 (cortex versus ctr); p < 0.05 (nucleus versus ctr)); C, CML (n.s (cortex and nucleus versus ctr)); D, G-H1 (n.s (cortex and nucleus versus ctr)) were determined by LC-MS. The Student's t test was used to compare the Ctr and HBO. CML and G-H1 were not elevated by HBO. Bars represent means ± S.D.

