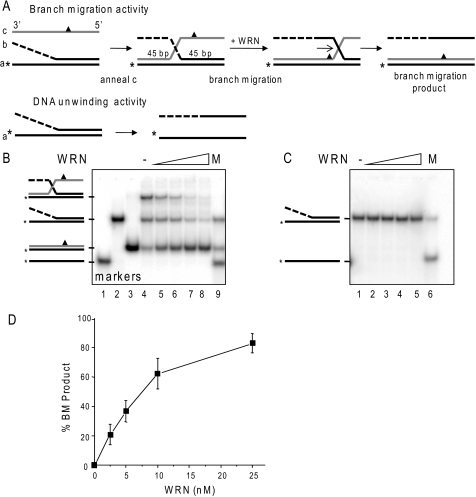
FIGURE 2.
Comparison of WRN branch migration and DNA unwinding activities. A, schematic showing three-stranded branch migration and DNA unwinding of a forked duplex. The asterisk denotes a radiolabel, and the triangle indicates four mismatches used to limit spontaneous branch migration. The dashed line indicates ssDNA of non-complementary sequence. B, the three-stranded substrate-annealing reactions were incubated for 15 min at 37 °C, diluted 1:3 (10 nm labeled oligonucleotide), and immediately incubated with increasing WRN concentrations (0, 2.5, 5, 10, or 25 nm) (lanes 4–8, respectively) for 15 min under standard reaction conditions. The migration of DNA markers, ssDNA (lane 1), forked duplex (lane 2), BM duplex product (lane 3), or a mix of all three (M, lane 9) is shown. C, forked duplex (10 nm labeled oligonucleotide) was incubated with increasing WRN concentrations (0, 2.5, 5, 10, or 25 nm) for 15 min under standard reaction conditions. The migration of ssDNA is shown (M, lane 6). Reactions were run on an 8% native polyacrylamide gel and visualized by PhosphorImager analysis. D, the percentage of duplex BM product in B was calculated as described under “Experimental Procedures” and plotted against WRN concentration. Values represent the mean and S.D. from at least three independent experiments.

