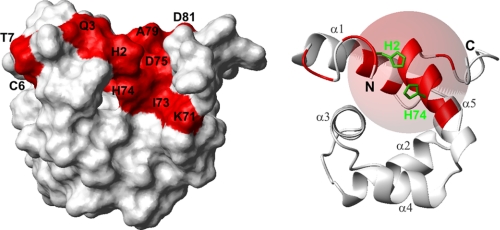
FIGURE 3.
Mapping of the microplusin binding region for copper II ions. Model structure of microplusin restraining His-2 and His-74 together. Residues not observable in a 1H-15N HSQC spectrum upon Cu2+ binding are colored red on the molecular surface of microplusin (left) and in the ribbon representation of the structure (right). A sphere of 9 Å, including almost all affected amides, has been added to the ribbon representation (right). The surface is in the same orientation as in Fig. 2.

