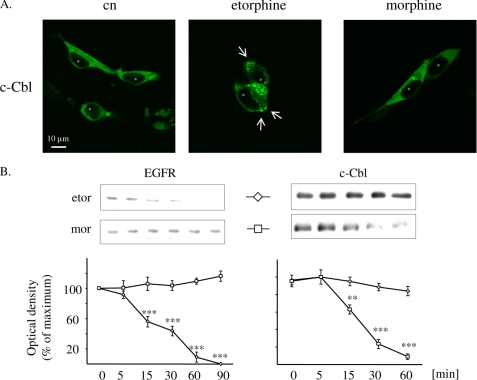
FIGURE 2.
Regulation of c-Cbl and EGF receptors by etorphine and morphine. A, HEK/DOR cells transfected with EGFP-tagged c-Cbl (green) were left untreated (cn) or were stimulated with 100 nm etorphine and 1 μm morphine for 5 min at 37 °C. The cells were fixed and cellular distribution of c-Cbl was analyzed by confocal microscopy. In unstimulated controls (cn), fluorescence associated with c-Cbl is distributed homogenously throughout the cytoplasm (* marks the nucleus). The addition of etorphine, but not morphine, results in a punctate accumulation of c-Cbl at the plasma membrane (arrows) and the cytosol. The images show representative cells taken from one of three independent experiments (space bar, 10 μm). B, serum-starved HEK/DOR cells were treated with etorphine (100 nm) and morphine (1 μm) for 5–60 or 90 min before the abundance of the EGF receptor (left panel) and of c-Cbl (right panel) was determined in whole cell lysates by Western blot technique. The abundance of EGF receptors and c-Cbl was quantitated by video densitometry and is expressed as a percentage of change from nontreated controls, which was set to 100%. The data shown are the mean values ± S.D. from at least three independent experiments. ***, p < 0.001; ** p < 0.01 versus non-opioid incubated control (0 min).

