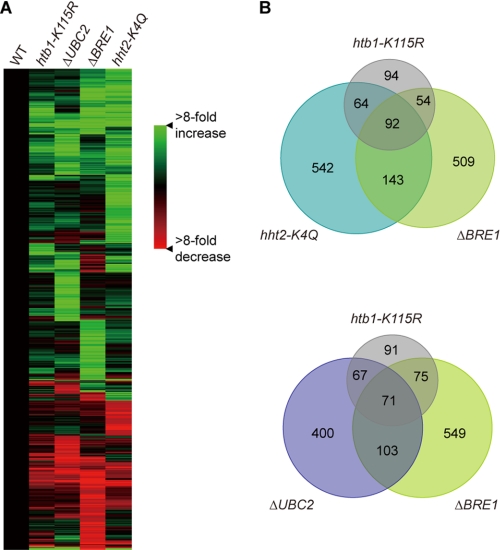
FIGURE 5.
Microarray analysis of gene expression profiles of wild-type (WT) CU428, HTB1, htb1-K115, ΔUBC2, ΔBRE1, and hht2-K4Q strains. A, genes whose expression levels were altered by at least 4-fold in one or more mutant strains (supplemental Table S1) were clustered using a hierarchical clustering algorithm. All data sets are normalized to the values of a wild-type CU428 strain. B, Venn diagrams show overlap among htb1-K115, hht2-K4Q, ΔUBC2, and ΔBRE1 data sets. The number of genes whose expression level had over 4-fold change is indicated.

