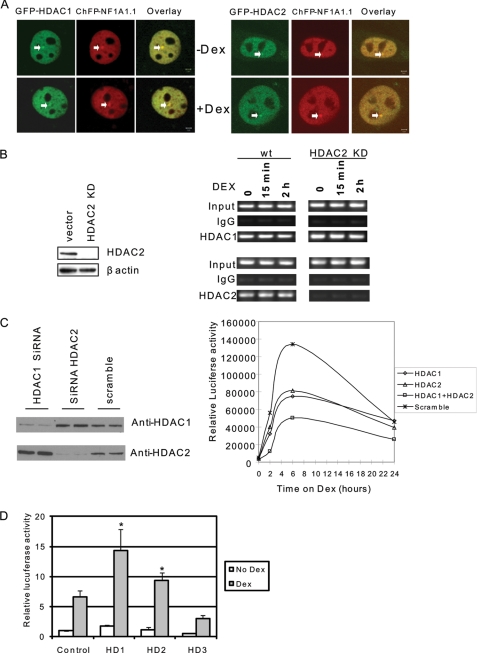
FIGURE 1.
Both HDAC1 and HDAC2 are required for MMTV transcription. A, HDAC1 and HDAC2 are localized on MMTV arrays. HDAC1 or HDAC2 were cotransfected with mCherry-NF1A1.1 in cell line 3617, which contains the MMTV array. Images were acquired using green (GFP-HDAC1) and red (ChFP NF1A1.1) fluorescence of the cells before and after 30 min of induction with Dex. NF1A1.1 is present at the array before and after Dex treatment and is used here as a marker for the array. The merged image shows the colocalization of HDAC1 or HDAC2 and NF1A1.1 at the MMTV array. Scale bars in the merged panels indicate 2 μm. B, knockdown of HDAC2 does not prevent the recruitment of HDAC1 on the MMTV promoter. 3134 cells, which contain stably incorporated MMTV promoter arrays, were stably transfected with shRNA of HDAC2. The HDAC2 levels were evaluated by Western blot (left panel) and chromatin immunoprecipitation using antibodies against HDAC1 and HDAC2 in control and knockdown cells (right panel). wt, wild type. C, HDAC1 and HDAC2 are required for MMTV transcription. Mouse NIH 3T3 cells containing stably integrated copies of an MMTV-luciferase reporter (cell line 6062) were transfected with a small interfering RNA pool directed against mouse HDAC1, HDAC2, or a scrambled RNA control. Cells were harvested for Western blot analysis to evaluate HDAC1 and HDAC2 levels (left panel) or treated with Dex and subjected to luciferase analysis to examine MMTV expression levels (right panel). This expression analysis is a representative example from four separate experiments. D, overexpression of HDAC1 or HDAC2 activates MMTV transcription. HDAC1, HDAC2, or HDAC3 in expression vectors were transfected into 6062 cells. Cells were treated with or without Dex for 6 h. The luciferase activity was determined. Each data bar represents the mean ± S.D. from triplicate measurements. Asterisk indicates significant difference (Student's t test, p < 0.01).

