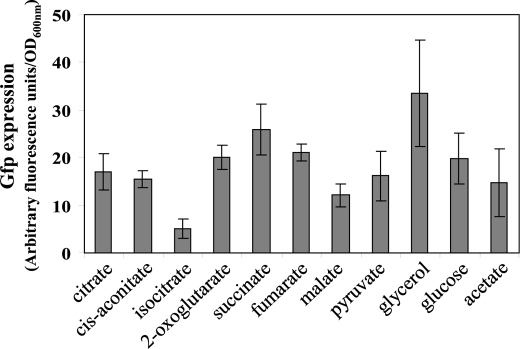
FIGURE 7.
Effect of Krebs cycle intermediates and other carbon sources on rsmZ-gfp expression. Strain CHA0/pME7402 was streaked on solid minimal media containing each compound as the sole carbon source. Concentrations were as follows: citrate, 10 mm; cis-aconitate, 10 mm; isocitrate, 10 mm; 2-oxoglutarate, 12 mm; succinate, 15 mm; fumarate, 15 mm; malate, 15 mm; glycerol, 20 mm; glucose, 10 mm; pyruvate, 20 mm; acetate, 30 mm. The pH was adjusted to pH 6.8 with NaOH, and agarose was added at a concentration of 1.0%. Two days after inoculation, colonies on each plate were scraped and suspended in 0.9% NaCl. The fluorescence (excitation at 480 nm and emission at 520 nm) and the optical density at 600 nm were measured with a Fluostar fluorescence microplate reader (BMG Lab Technologies).

