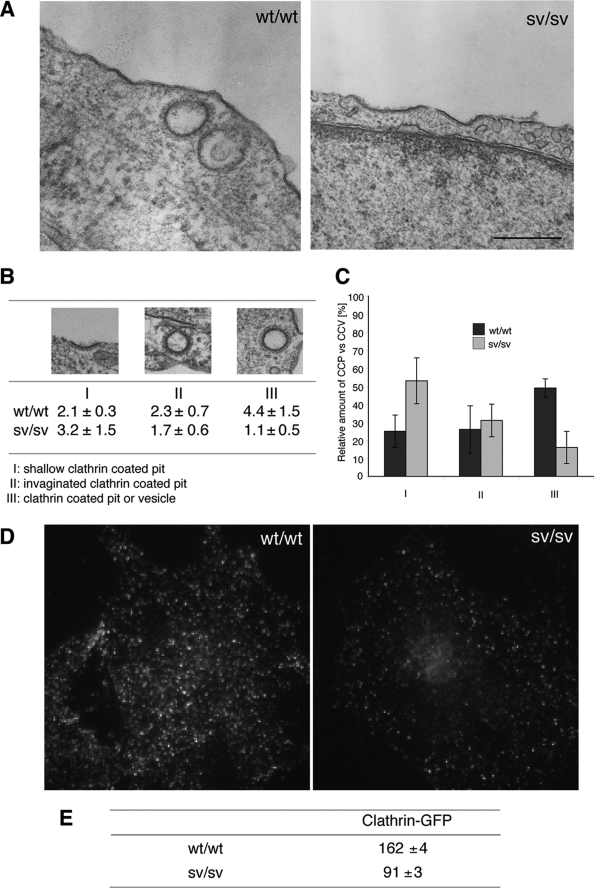
FIGURE 2.
Ultrastructural analysis of CCS at the plasma membrane in Snell's waltzer mouse fibroblasts. A, for ultrastructural analysis of CCS at the plasma membrane, wt/wt, and sv/sv fibroblasts were processed for Epon-embedding EM. Representative electron micrographs of wt/wt and sv/sv fibroblasts indicate that sv/sv fibroblasts show a higher number of shallow CCP and a lower number of invaginated CCP or CCS without connection to the plasma membrane Bars: wt/wt, 200 nm; sv/sv, 500 nm. B, results of a morphometric analysis counting CCS in 10 cell profiles and normalized for 1000 μm of cell perimeter in four different experiments (±S.D.) are shown. For quantitation the CCS were divided into three different categories: I, shallow CCP; II, deeper invaginated CCP; and III, clathrin-coated pits or vesicles with no obvious connection with the plasma membrane. C, a histogram of the relative amounts of the three different categories of CCS in wt/wt or sv/sv fibroblasts. D, wt/wt and sv/sv mouse fibroblasts were transfected with GFP-tagged clathrin light chain and analyzed by epifluorescence microscope. E, TIRF microscopy was used to score 500 fields from each of the samples in the experiment shown in D, and the fields were analyzed by Volocity software to quantify the amount of clathrin structures in the two different cell lines. The numbers are an expression of the average intensity of GFP-clathrin in the different fields ± S.E.

