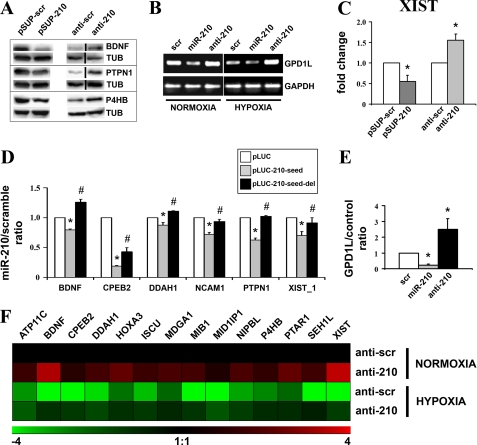
FIGURE 4.
Confirmation of a panel of identified targets. A, HEK-293 cells were transfected with plasmids encoding either miR-210 (pSUP-210) or a scramble sequence (pSUP-scr). Alternatively, cells were transfected with either scramble (anti-scr) or anti-miR-210 (anti-210) LNA oligonucleotides. Then, 40 h later, cell extracts were derived, and the protein levels of the indicated proteins were assayed. Representative Western blots are shown (n = 3–5). Black lines indicate where irrelevant lanes were removed. B, MCF7 were transfected with scramble, miR-210, or anti-miR-210 oligonucleotides and cultured in normoxic or hypoxic conditions. Then, 40 h later, total RNA was extracted, and the indicated mRNAs were measured. The figure shows semi-quantitative RT-PCR of GPD1L mRNA (n = 3). GAPDH mRNA levels were used for normalization control. C, HEK-293 cells were transfected as indicated in panel A. Then, total RNA was extracted and Xist levels were assayed by qPCR. GAPDH mRNA levels were used for normalization purposes (n = 4; *, p < 0.05). D, for each indicated gene, HEK-293 were transfected with vector alone (pLUC) or firefly luciferase constructs that contain either an intact miR-210 binding site (pLUC-210-seed), or a mutated miR-210 binding site (pLUC-210-seed-del). Each pLUC plasmid was co-transfected with a plasmid encoding Renilla luciferase along with a plasmid encoding either miR-210 or a scramble sequence. Firefly luciferase values were normalized according to Renilla luciferase activity, and the ratio of luciferase activity of each construct in the presence or in the absence of exogenous miR-210 was calculated (n = 4–6; *, pLUC versus pLUC-210-seed p < 0.05; #, pLUC-seed versus pLUC-210-seed-del p < 0.05). E, MCF7 were transfected with pGL3 (control) or pGL3-GPD1L-3′-UTR (GPD1L) along with scramble, miR-210 or anti-miR-210 oligonucleotides. The GPD1L/control ratio of luciferase activity upon miR-210 overexpression or blockade of was calculated (n = 3; *, p < 0.05). F, HUVEC were transfected with anti-scramble or anti-210 LNA oligonucleotides, and, 18 h later, cells were exposed to hypoxia for a further 24 h. Then, total RNA was extracted, and the indicated mRNAs were measured. The heat map represents the average modulations in different groups, compared with the anti-scramble/normoxic control (n = 3, p < 0.04). Green and red colors indicate down- and up-regulation, respectively.

