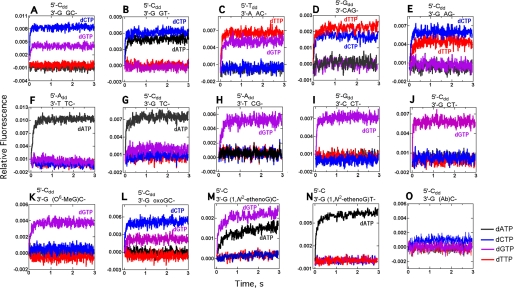
FIGURE 4.
Fluorescence changes for Dpo4 T239W following mixing of each of four dNTPs opposite a 13/18-mer primer (3′-dideoxy terminated)-template pair. The relevant portion of the DNA sequence within the region of dNTP binding is shown above each graph (see Table 1 for remainder). The final concentrations of the Dpo4 T239W-oligonucleotide complex and dNTP were 1.0 and 0.5 mm, respectively. dATP (black), dTTP (red), dCTP (blue), and dGTP (purple).

