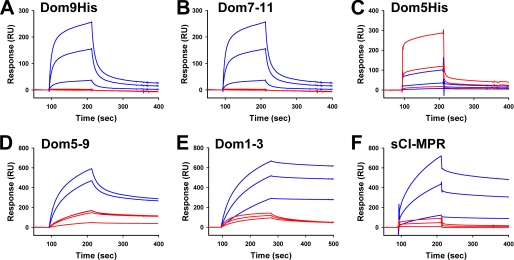
FIGURE 4.
SPR analysis of MPR constructs binding to GAA phosphomonoester or GAA phosphodiester. Similar amounts (2500 and 2300 response units, respectively) of GAA monoester and GAA diester were immobilized on the surface of a CM5 sensor chip (panels A–D and F). MPR constructs were injected in a volume of 80 μl over the coupled and reference flow cells at a rate of 40 μl/min. After 2 min, the solutions containing the MPRs were replaced with buffer and the complexes allowed to dissociate for 3 min. Shown are representative sensorgrams for: A, Dom9His at 10 nm, 100 nm, and 1 μm; B, Dom7–11 at 10 nm, 100 nm, and 1 μm; C, Dom5His at 10 nm, 100 nm, and 1 μm; D, Dom5–9 at 10 nm, 100 nm, and 1 μm; and F, sCI-MPR at 10 nm, 100 nm, and 1 μm comparing the response on GAA phosphomonoester (blue lines) and GAA phosphodiester (red lines) surfaces. E, Dom1–3 was immobilized on the surface of a CM5 sensor chip and GAA monoester or GAA diester were injected in a volume of 80 μl over the Dom1–3 and reference flow cells at a rate of 40 μl/min. After 3 min, the solutions containing the GAA lysosomal enzymes were replaced with buffer and the complexes were allowed to dissociate for 3 min. Shown are representative sensorgrams of the GAA phosphomonoester (blue lines) and GAA phosphodiester (red lines) at 10 nm, 100 nm, and 1 μm. Kinetic parameters were determined by global fitting of the sensorgrams to a 1:1 binding model using BIAevaluation version 4.0.1 software and summarized in Table 1.

