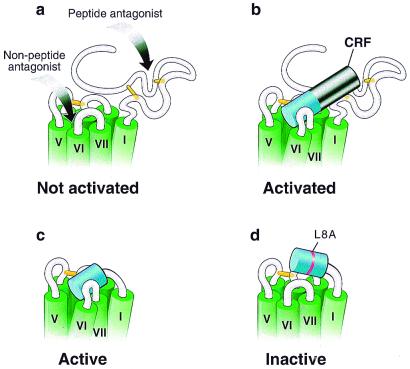
Figure 4.
Propinquity model for R1 and CRF(1–16)/R1ΔN activation. Schematic representations of the upper portion of R1. The transmembrane segments are indicated in green and are based on models of GPCRs (6, 44). The putative disulfide bridges important for binding are indicated in yellow (45). (a) R1. The putative regions involved in binding of antagonists are indicated by arrows. The peptide antagonist is presumed to bind to the N-terminal domain (17), whereas the nonpeptide antagonists bind in the transmembrane region (27). The receptor in the absence of agonist is represented in an inactivated state. (b) R1 activated by CRF. The first 16 residues of CRF are shown in blue, whereas the remaining (17–41) residues are shown in black. The receptor is represented in an activated state. (c) Constitutively activated chimera. The figure shows the chimera in which the first 16 residues of CRF are tethered to the receptor in place of its N-terminal domain. The tethered peptide stabilizes the chimera in an active state. (d) Inactive chimera. The figure shows the chimera in which the CRF peptide portion contains the mutation L8A and is tethered to the receptor in place of its N-terminal domain. This point mutation prevents the tethered peptide from stabilizing the chimera in an active state.

