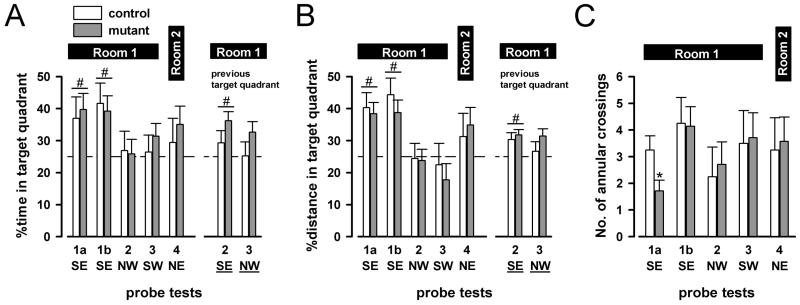
Figure 5.
Probe trial performance is indexed by percent time in target quadrant (A), percent distance in target quadrant (B) and the number of annular crossings (C). Two probe trials were conducted during the first acquisition phase (1a and 1b). Subsequently, one probe trial was conducted prior to training on the 4th (and the last) day in each successive new learning phase (probe tests 2, 3 and 4). The corresponding target quadrant is also listed below the x-axis. In addition, percent time (A) and percent distance (B) spent in the (underlined) quadrants in which the platform was located in the previous learning phase are also illustrated for probe tests 2 and 3. Error bars refer to ±SEM, mutant (n=7), control (n=4). # indicates that mutants and controls performed significantly above chance level (25%) based one-sample t-tests separately conducted for the five probe tests (p<0.05). * denotes a significant difference (p<0.05) between mutants and controls according to a one-way ANOVA of annular crossings restricted to probe trial 1a.

