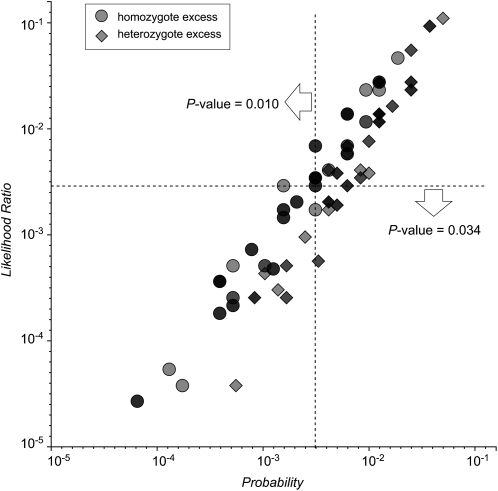
Figure 2.—
Distribution of test statistics. The likelihood ratio and probability were computed for each of the 139 possible tables with allele counts  . Overlapping symbols are indicated by darker shading. Dashed lines intersect at the specific table (see text) whose P-value is being evaluated by the two exact tests. Both axes are logarithmically scaled.

