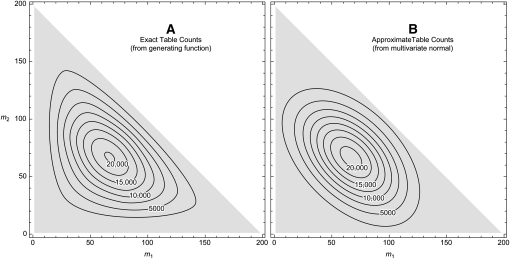
Figure 5.—
Numbers of tables. Contour plots show the numbers of tables for each possible set of allele counts when n = 100 diploids and k = 3 alleles. (A) The exact number of tables was computed by the generating function method of Equation 4. (B) The approximate numbers of tables were found by multiplying the multivariate normal density (Equation 11) by the total cardinality (Equation 5). Note that the counts of the first two alleles are indicated while the third allele is implicit, as  .
.

