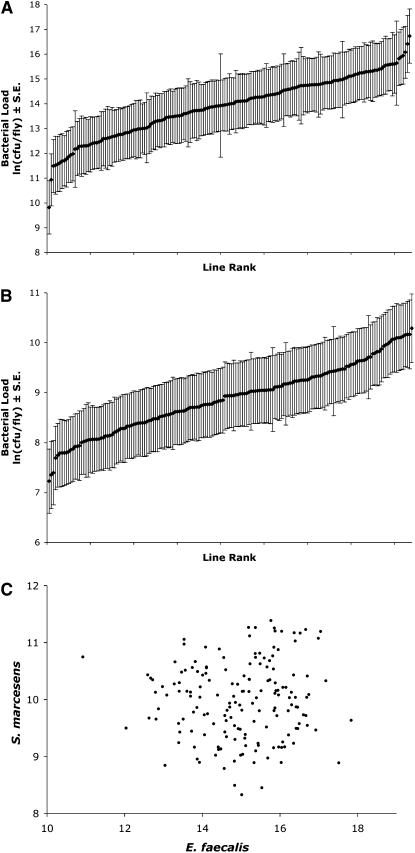
Figure 1.—
Line means of bacterial load after infection with (A) Enterococcus faecalis, B) Serratia marcescens, and (C) scatterplot of means of load for the two bacteria. Lines are plotted in rank order for each bacterium in A and B. Bacterial load is measured as the natural log of the count of colony-forming units per fly, ln(cfu/fly), shown with the standard errors of the mean.

