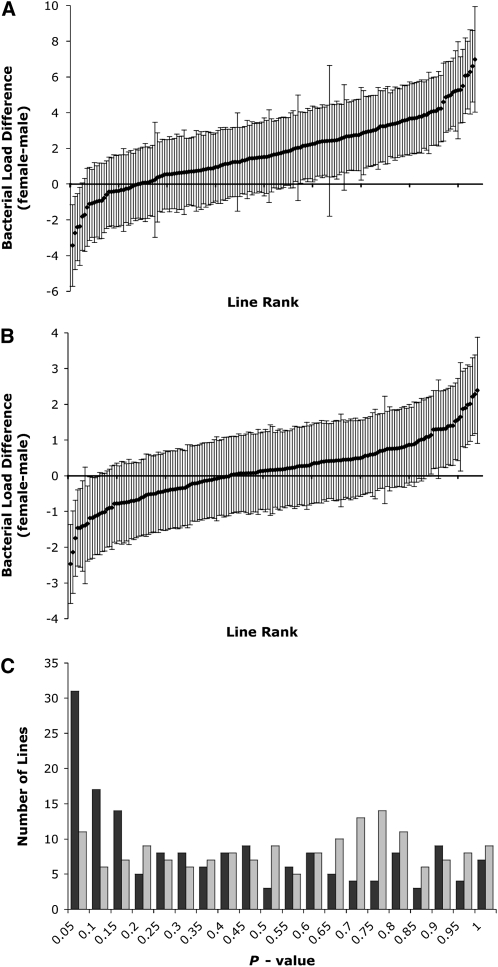
Figure 2.—
Sex differences in mean bacterial load after infection with (A) E. faecalis and (B) S. marcescens, displayed as (female ln(cfu/fly) – male ln(cfu/fly)) ± (standard error of the difference), and (C) histogram of P-values of t-tests of sex difference in all lines after E. faecalis infection (black bars) or S. marcescens infection (gray bars).

